Repository navigation
Dart reporting incorrect code while code is correct (server overlays get out of sync with editor when analyzer plugins are used) #3761
Description

Describe the bug
We have noticed that since about a week or two ago that dart is reporting code errors that don't exist, of code that doesn't exist.
The issue doesn't present itself right after a new boot of Visual Studio Code, however typically after 5-10 minutes. The bug prevents us from hot reloading because of "errors in the code" that aren't there.
It will also stop properly suggesting code as it seems to think that there is different code in the file than is visible on the screen.
When opening the file in another text editor, we see the same code as we see in vscode, so it's not saving the file wrong.
Typically closing the file and re-opening the file will fix this issue until you make one more code edit. You will need to restart vscode in order to fix the issue completely.
In the image you can see we have "aboutSecurity", but Dart thinks it is saying "aboutSecurityaboutSecurity...."
Please let me know what additional information I should provide in order to debug this issue.
To Reproduce
Steps to reproduce the behavior:
- Edit a file
- After a while of editing the file, the behavior starts occurring
Expected behavior
Dart not reporting errors of code that doesn't exist
Screenshots

Versions (please complete the following information):
- VS Code version: 1.63.2
- Dart extension version: 3.29.0
- Dart/Flutter SDK version: Flutter 2.8.1
Activity
DanTup commentedon Jan 2, 2022
It looks like the servers overlay has gotten out of sync with what's in the editor (the servers overlay is the contents of the file from the editor, so it can lint/etc. unsaved changes). This could be confirmed by checking the overlay for a file when this happens:
How this is happening, I'm not sure. Can you reproduce it reliable? If so, enabling the instrumentation log might help (though be aware it will include lots of your source code in it before sharing):
"dart.analyzerInstrumentationLogFile": "logs/analyzer.txt"into the JSON fileThis will start logging all communication with the server into that file which might help understand what's happening.
Could you also confirm the list of all extensions you have installed? I'm curious if you have anything handling the
typecommand (like Vim) which has triggered some issues similar to this in the past. Thanks!Cellaryllis commentedon Jan 2, 2022
Hey,
Thanks for the quick response! I have checked the priority file contents* and indeed, it's gibberish.
I have been trying to reproduce the issue in a new test widget that I made but I haven't been able to make it crash. I will keep trying and once i get it repro'd I will send you the file.
Here's a list of my extensions:
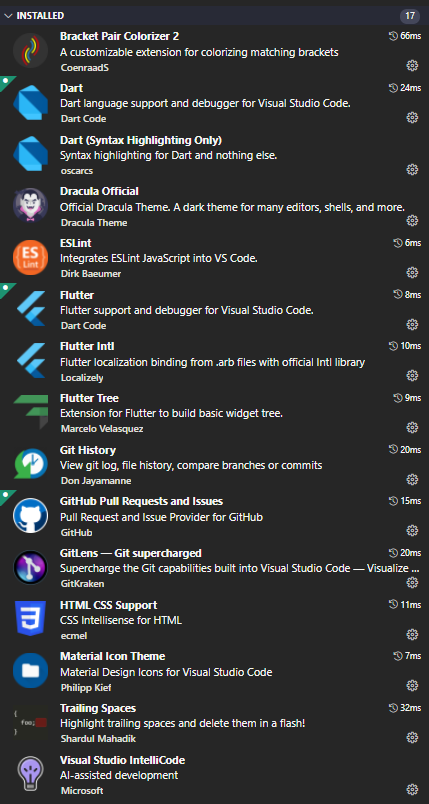
Nothing fancy that I can see in here that would cause it.
Cellaryllis commentedon Jan 2, 2022
Hey,
I managed to reproduce it, it occurred at random. I've attached the last part of the file that has the error up until the analyze before it that doesn't have the error. If you need more data I'll have to see what I can extract from it. (Because as you say it does contain a whole bunch of source code).
The issue in this instance is: noPollResultslResultsoon
I attached the image from vscode and the image from the analysis server.
If you do need the whole file, let me know.
dart-error-analyze.txt
Cellaryllis commentedon Jan 2, 2022
Also, not sure if it's worth noting but the Dart Code plugin just updated itself to v3.32.0 (which is where the log is from as well). So the issue also still occurs on v3.32
DanTup commentedon Jan 2, 2022
Aha! I see duplicate requests in your log, including the notifications for document changes:
This is certainly the cause (for ex if you type "foo" at offset 10, but the server is told about this twice, it will insert it twice into its overlay since it is just applying deltas). This is an issue that came up and I fixed recently - see dart-lang/sdk#47851 (comment). The trigger is having an analyzer plugin which is likely why you couldn't repro in a new project. I can see from your log that you have a plugin enabled (although I'm not sure which -
dart_code_metricsis the one that triggered it last time, but any plugin can likely cause it - and it's not a fault of the plugin but a bug in the Dart LSP server).The issue was fixed by dart-lang/sdk@a3f591f but that hasn't made a stable Dart SDK release yet (it should be in the next major Dart SDK release, and is probably already in dev channel of the Dart SDK, although I'm not sure which Flutter channel besides
masterit's in yet).Until then, you may be able to avoid it by disabling the analyzer plugin, or perhaps disabling LSP (with the
dart.useLspsetting) - although you may ofc lose some functionality doing either. Another option if it's not occurring that frequently could be that whenever you notice it, save your files then run the Reload Window command in VS Code which will restart all extensions, which includes restarting the analysis server (this will only be a temporary fix and it may come back after a while again).[-]Dart reporting incorrect code while code is correct[/-][+]Dart reporting incorrect code while code is correct (server overlays get out of sync with editor when analyzer plugins are used)[/+]DanTup commentedon Jan 4, 2022
Closing this as I believe the issue is resolved for a future Dart SDK release, but if you still see this on a version newer than 2.16.0-92.0.dev (which appears to be the first one that contains the fix above), please let me know!