Repository navigation
analyzer takes many seconds for Snippets+Overrides completions in files that are part of "large" libraries #4364
Description

Autocomplete is much faster for me when I use the old analyzer protocol:
Dart.Analyzer.1.mp4
This is a proprietary codebase so unfortunately I'm not able to share it. A few things about this codebase which may be relevant:
- This is a web application which uses dart2js to compile to HTML + JS.
- This codebase is spread over ~20 packages. There is a main package which imports all the sub-packages.
- The main library has a file which imports 33 packages, including 8 from the Dart SDK. It has 49
partdeclarations for files within the repository. Most other files don't have imports, and instead usepart ofto inherit the global scope provided by the main file. Most of the other packages in this project do the same.
Please let me know if there is anything else I can share about this codebase.
I've included the info above about imports because the new analyzer protocol seems slowest when trying to autocomplete in the global scope. As you can see in the video, it's much faster once there's a narrower context.
SDK: v2.19 (from Flutter 3.7.0)
OS: Windows 11
Specs: 8th generation i7, 32gb ram
Activity
DanTup commentedon Jan 26, 2023
@Secondflight can you confirm a few things:
"dart.autoImportCompletions"setting set to, and does toggling it to the opposite seem to affect the difference in timings?packages/flutter/lib/material.dartat the very end of the file appears in less than 1 second, so your video does seem very slow (although I'm not using your project and I don't know if there may be something specific triggering this)Thanks!
josh-audio commentedon Jan 26, 2023
Hi @DanTup, thanks for the quick response!
"dart.autoImportCompletions"is set to false in the video, but it doesn't seem to make a difference here.Dart.Analyzer.2.mp4
josh-audio commentedon Jan 26, 2023
I'm wondering if this has something to do with how we're abusing imports in this project. Most packages in our project are constructed almost entirely with
part/part of.I can test this theory by constructing a large project using
partstatements. I don't have time now, but I'll reply here when I get the chance to do that.DanTup commentedon Jan 26, 2023
If you're able to reproduce it with something shareable that would really help.
Something else that might be useful:
This should give you a page like the below, which might at least show which part of completion is taking the time:
josh-audio commentedon Jan 26, 2023
Okay, makes sense. I'll see what I can do.
Thanks for those steps, I think I got something interesting. First off, it looks like I was wrong - disabling
dart.autoImportCompletionscuts the time from ~10s to ~5s.Here's the output with
dart.autoImportCompletionsset to true.DartCompletionManager - NotImportedContributorandgetSnippetsboth take nearly 5 seconds:Click to expand
Disabling
dart.autoImportCompletionsleaves justgetSnippets- the rest are very short:Click to expand
josh-audio commentedon Jan 26, 2023
Disabling
dart.enableServerSnippetsfixes the other 5s. It's still noticeably slow compared to the Flutter codebase, but most completions happen within 1s.DanTup commentedon Jan 26, 2023
Oh, that's interesting to know. Are you able to construct a repo you can share? If we're taking 5s to do those snippets, we absolutely need to fix that.
Edit: Missed the other comment about NotImportedCompletions. Sounds like we also need to improve that. Anything you can do to get us a repro that has these sorts of timings would really help us track down why it's slow for you.
josh-audio commentedon Jan 26, 2023
I can't do it today, but I'll do it ASAP - probably early next week. I'll ping you when I get some more time to spend on it.
DanTup commentedon Jan 26, 2023
Great, thanks!
josh-audio commentedon Feb 2, 2023
Hey @DanTup,
I've spent a few hours trying to reproduce the issue, but haven't gotten anywhere yet. I've recreated a similar project structure, but the suggestions in my repro project are still really fast.
Just writing here to say I'm still working on it. Please let me know if you have any suggestions on how I might trace the issue.
DanTup commentedon Feb 2, 2023
@Secondflight I actually started looking at this today too. I think I understand how snippets can be slow, but I would expect it only to be the very first request (it triggers some expensive work to discover all available files). Can you confirm whether you see it adding on 5s only the first time it's invoked, or all?
As for getting a repro - I don't know how big your project is, but I would probably start by making a copy of it, and then start deleting all the bodies of code (you can use
throwto avoid having to make functions return the right types) and see whether you can get to something that still reproduces it but might be shareable. I don't know how feasible that is though if your project is massive.josh-audio commentedon Feb 2, 2023
@DanTup It does speed up, but it stabilizes to something that's still pretty slow:
Also, I made the mistake of not recording where I had the 10s - I've been seeing 2s-3s in most function bodies.
NotImportedContributorisn't causing issues anymore either which is strange.Here's the breakdown of that last suggestion.
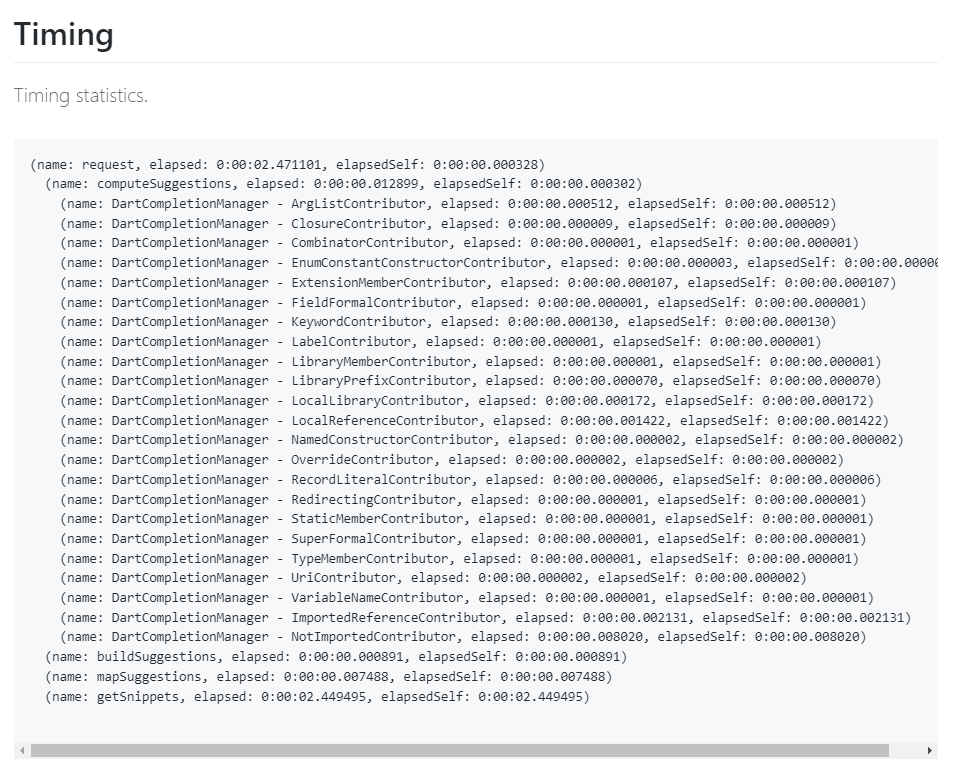
getSnippetsis the vast majority:josh-audio commentedon Feb 2, 2023
I appreciate this. I probably still can't share the result, but it's a different angle to attack the problem. Our codebase is ~100k lines of Dart plus HTML and CSS, so it's not small but not unmanageably large either.
33 remaining items
DanTup commentedon Mar 22, 2023
I can do that if you think it's worthwhile - though I don't know whether it's a good or bad trade-off (users with smaller libraries that aren't so slow might miss these). My message wasn't a prompt to do something, just an FYI in case you hear similar complaints :-)
It could be worth making the budget apply in more places (so we'd never take this long), although there's a part of me that dislikes stopping work early and giving incomplete results (because sometimes I might prefer to wait a little longer and get results than not).
Anyway, something to come back to :-)
[-]`getSnippets` analyzer step takes ~5s to complete in files that are `part of` "large" libraries[/-][+]analyzer takes many seconds for Snippets+Overrides completions in files that are `part of` "large" libraries[/+]DanTup commentedon May 18, 2023
This is resolved by @scheglov's change at dart-lang/sdk@92faa11. In my test case with 100 parts in a single library, the time dropped from 17s (first) and 9s (subsequent) to 760ms (first) and 175ms (subsequent). This was a deliberately extreme case though so the total times are likely much lower for real world code.
The change is part of the Dart SDK (not the VS Code extension), so it will show up after a future SDK update.