Repository navigation
Scrolling ListView causes memory usage to vary by >10MB over time #20245
Description

When I used listview to design a list with 100 items (using the same image), I found that when I scrolled up and down the list, the memory of _List will continue to increase, so the overall memory is also increasing, why memory Will it always increase? Native list will ensure stable memory when doing the same operation.
Steps to Reproduce
- Connect the Android device( os version 4.4.4/7.0 )
- Run->

- Click the [Launch screen] button on the phone
- Scroll up and down several times


Scroll up and down several times


Code
https://github.com/Wanghuayin/flutterlistdemo
@override
  Widget build(BuildContext context) {
    return Scaffold(
      appBar: AppBar(
        title: Text("Second Screen"),
      ),
      body: ListView.builder(
        itemCount: items.length,
        itemBuilder: (context, index) {
          return ListTile(
//            key: new Key('list-$index'),
            title: new Container(
              decoration: new BoxDecoration(border: new Border(top: new BorderSide(width: 1.0, color: Colors.grey.shade300))),
              padding: EdgeInsets.only(top: 7.0),
              child: new Row(
                children: <Widget>[
                  new Container(
                    child: Image.network(
                      'http://gw.alicdn.com/mt/TB1p6R6G41YBuNjy1zcXXbNcXXa-220-120.jpg',
                      width: 220.0,
                      height: 120.0,
                      fit: BoxFit.fill,
                    ),
                  ),
                  new Container(
                    margin: new EdgeInsets.only(left: 10.0),
                    child: new Column(
                      children: <Widget>[
                        new Padding(padding: new EdgeInsets.fromLTRB(50.0, 1.0, 1.0, 1.0)),
                        new Text("title $index", style: new TextStyle(fontSize:14.0, color: Colors.red),),
                        new Padding(padding: new EdgeInsets.fromLTRB(1.0, 20.0, 1.0, 1.0)),
                        new Text("desc $index", style: new TextStyle(fontSize:12.0, color: Colors.blue),),
                      ],
                    ),
                  ),
                ],
              ),
            ),
          );
        },
      ),
    );
}
log
dengyangdeMacBook-Pro:flutter_app dengyang$ flutter doctor -v
[KWLM]:[doctor, -v]
[✓] Flutter (Channel xy_beta_v0.5.6, v0.5.6-pre.108, on Mac OS X 10.13.4 17E199, locale zh-Hans-CN)
    • Flutter version 0.5.6-pre.108 at /Users/dengyang/SourceCode/FlutterProject/fwn_idlefish/flutter
    • Framework revision f8ba2eeab6 (12 days ago), 2018-07-25 16:48:19 +0800
    • Engine revision 6fe748490d
    • Dart version 2.0.0-dev.63.0.flutter-4c9689c1d2

[!] Android toolchain - develop for Android devices (Android SDK 28.0.0)
    • Android SDK at /Users/dengyang/Library/Android/sdk
    • Android NDK at /Users/dengyang/Library/Android/sdk/ndk-bundle
    • Platform android-27, build-tools 28.0.0
    • ANDROID_HOME = /Users/dengyang/Library/Android/sdk
    • Java binary at: /Applications/Android Studio.app/Contents/jre/jdk/Contents/Home/bin/java
    • Java version OpenJDK Runtime Environment (build 1.8.0_152-release-1024-b01)
    ! Some Android licenses not accepted.  To resolve this, run: flutter doctor --android-licenses

[✓] iOS toolchain - develop for iOS devices (Xcode 9.4.1)
    • Xcode at /Applications/Xcode.app/Contents/Developer
    • Xcode 9.4.1, Build version 9F2000
    • ios-deploy 1.9.2
    • CocoaPods version 1.5.3

[✓] Android Studio (version 3.1)
    • Android Studio at /Applications/Android Studio.app/Contents
    • Flutter plugin version 25.0.1
    • Dart plugin version 173.4700
    • Java version OpenJDK Runtime Environment (build 1.8.0_152-release-1024-b01)

[!] IntelliJ IDEA Ultimate Edition (version 2017.3.2)
    • IntelliJ at /Applications/IntelliJ IDEA.app
    ✗ Flutter plugin not installed; this adds Flutter specific functionality.
    ✗ Dart plugin not installed; this adds Dart specific functionality.
    • For information about installing plugins, see
      https://flutter.io/intellij-setup/#installing-the-plugins

[✓] IntelliJ IDEA Community Edition (version 2017.3)
    • IntelliJ at /Applications/IntelliJ IDEA CE.app
    • Flutter plugin version 22.1.2
    • Dart plugin version 173.4548.30

[✓] VS Code (version 1.24.1)
    • VS Code at /Applications/Visual Studio Code.app/Contents
    • Flutter extension version 2.16.0

[✓] Connected devices (1 available)
    • SM G950U • 9887a8335150524c59 • android-arm64 • Android 7.0 (API 24)

! Doctor found issues in 2 categories.
Activity
Wanghuayin commentedon Aug 7, 2018
After I tried to remove the picture from the list, when I scrolled up and down the list, the memory of _List will continue to increase, so it seems that it should be irrelevant to the picture. In time, the app back to the background, and the memory is not released in time,This operation may trigger a memory leak in the Listview
Wanghuayin commentedon Aug 7, 2018
Scrolling up and down (Base on custom 0.5.6 version of the Xianyu)
Wanghuayin commentedon Aug 8, 2018
Base on the official 0.5.6 version
jason-simmons commentedon Aug 9, 2018
I looked into the memory consumption of this app during scrolling and noticed some unusual behavior in the Dart garbage collector:
kparameter inPageSpaceController::EvaluateGarbageCollectionis calculated with a low value. The search forlocal_grow_heapconverges onheap_growth_max_, resulting in the outputgc_threshold_in_words_reaching a value on the order of 75MB.If these two effects occur, the process will continue to accumulate tens of MB of old generation objects before triggering a full GC.
@rmacnak-google @a-siva
[vm, gc] More aggressively consider idle compactions.
Wanghuayin commentedon Aug 13, 2018
I did the another test with the engine change by Change-Id(Ie993f4bbac6435b2305e46cfbe0e95115e8554f8) again in the same scene, it's true that GC is much more active than before, but the total memory still increase with scrolling up and down
New Generation
used 980.4KB of 16.0MB
external 185.3KB
collections 126
average collection time 6.17 ms
cumulative collection time 0.78 secs
average time between collections 3861.12 ms
Old Generation
used 6.8MB of 7.0MB
external 184.5KB
collections 8
average collection time 17.09 ms
cumulative collection time 0.14 secs
average time between collections
Too frequent GC may affect the user experience @jason-simmons @rmacnak-google @a-siva
rmacnak-google commentedon Aug 14, 2018
What is "VM Memory" and why is it going down?
Wanghuayin commentedon Aug 14, 2018
@rmacnak-google, sorry, it's my bad, i mistakenly treat the "VM activities" as "VM memory", i have updated the previous comment
rmacnak-google commentedon Aug 14, 2018
Oh, sorry, I thought you were adding a value from some other tool. The UI should be more clear: the pie chart and its legend are reporting time (profile ticks), not memory. The fact that "Dart" is going up means that after startup a greater proportion of time is spent in generated code, and "VM" going down means that a smaller proportion of time is spent in the runtime.
Hixie commentedon Aug 14, 2018
@Wanghuayin Can you confirm that there is still an issue here?
Wanghuayin commentedon Aug 15, 2018
@rmacnak-google @Hixie
I still have two questions?
5 remaining items
Hixie commentedon Aug 21, 2018
@Wanghuayin Those graphs look great. Is there anything you'd still like us to do here?
Wanghuayin commentedon Aug 22, 2018
@Hixie Because the memory problem is block issue in the Xianyu app, I hope to solve the memory problem asap, thanks million!
Btw, the high utilization of the CPU in the ListView scenario is also a problem worthy of attention.
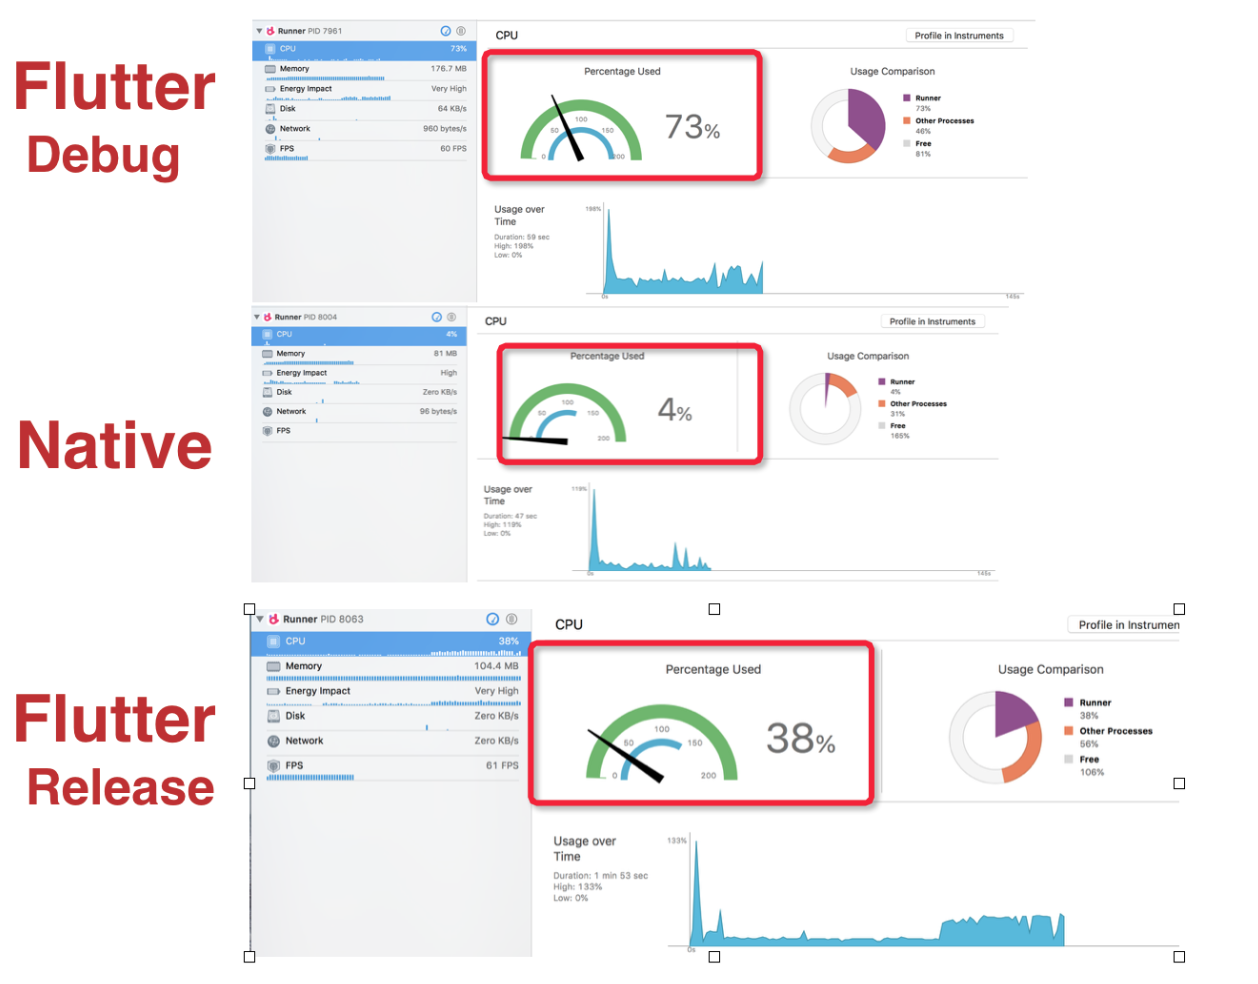
Hixie commentedon Aug 22, 2018
@Wanghuayin could you provide a test app and specify exactly what metrics you'd like us to hit? This bug is a bit vague so far, we're not clear on what needs to happen exactly or what exactly the problem is.
Wanghuayin commentedon Aug 23, 2018
hi @Hixie
Just scrolling up and down
[-]Memory issue on ListView.builder[/-][+]Scrolling ListView causes memory usage to vary by >10MB over time[/+]Hixie commentedon Aug 28, 2018
@Wanghuayin Can you elaborate on why varying memory usage might cause lack of smoothness or crashes?
Generally speaking this is the behaviour we would expect, as we allocate memory then release it each time we do a garbage collection sweep. We could just not release it, but that seems worse overall. I suppose we could release it less often, maybe?
Wanghuayin commentedon Aug 29, 2018
@Hixie I think that the flutter listview is not smooth compared to the native Native listview, doing the same operation on the native listview, the experience will be smoother than flutter, and in the memory management, the native listview scrolling. At the time, the memory is almost constant (why is just a simple scrolling operation, flutter will have such a large memory change, is it determined by the mechanism of skia?)
About Crash, I am sorry, it is my guess, I just seriously studied the isolate of memory, found that the probability of Crash under the isolate mechanism will be lower than Native, because the upper limit of isolate memory is system memory?
Under the premise of ensuring performance, it is a good idea to perform memory recycling more frequently, or you can go deep into why there is a large memory fluctuation under such a simple listview.
Hixie commentedon Sep 4, 2018
If you mean that the Android list view has a smoother memory usage graph, then that is not very surprising to us, as it probably is just an indication of a different garbage collection and allocation model. Java's "recycler view" model is to reuse the same objects over time, avoiding allocation, whereas Flutter's "react-style" model is to allocate new objects every time there is a new item in the list, or any time the items change. The results of this is that the memory graph will appear less smooth, and allocations will appear to be happening more often, but the end result should be the same user experience.
To clarify, this is not related to Skia but to the "react-style" model that Flutter's framework uses.
We don't believe that there should be any difference in probability of crash in the "react-style" model vs the "recycler" model, but we're not sure we fully understand your concern. The allocated memory is released regularly, so there should not be a concern of the memory usage being unbounded.
The actual amount will depend on Dart's garbage collection settings. If you're seeing 10MB, then I would assume that this means that our garbage collector is tuned to collect garbage when there are about 10MB of allocations to clean up.
Wanghuayin commentedon Sep 7, 2018
@Hixie thank you very much for your information that refreshed my cognition,
I think the memory problem we encountered should be in a more complicated scenario. We will continue to follow up on this issue.
github-actions commentedon Aug 15, 2021
This thread has been automatically locked since there has not been any recent activity after it was closed. If you are still experiencing a similar issue, please open a new bug, including the output of
flutter doctor -vand a minimal reproduction of the issue.