Repository navigation
Android memory leaks until it is killed by the system #31303

Description

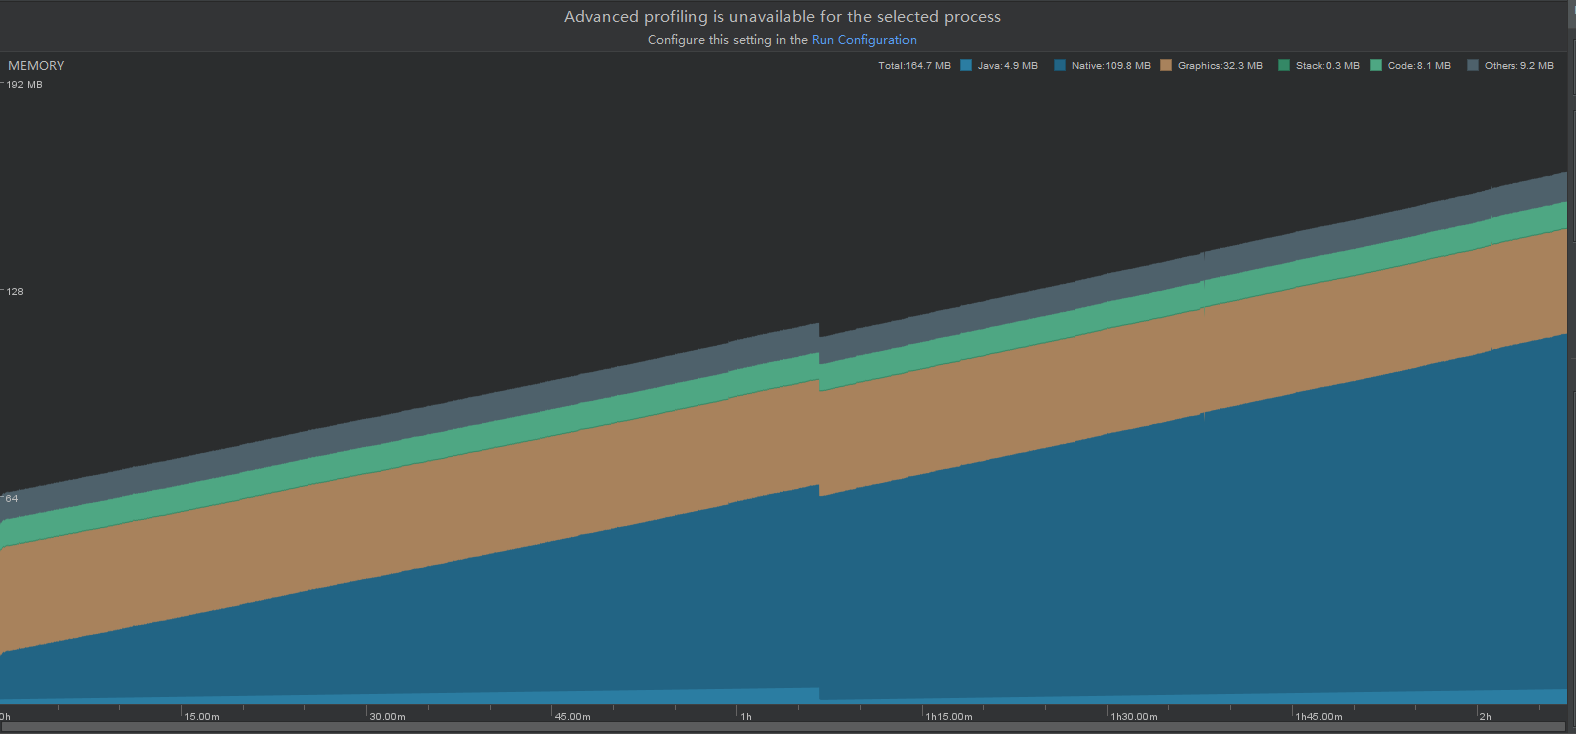
We tested the latest version, as well as beta version, and found that if any animation on the APP plus a picture, it would lead to a constant increase in memory. The more complex the UI, the faster the memory grows (Native memory).
The simplest version below, with only one picture and one animation

When APP goes back to the background, Native memory decreases slightly. In the background, the memory will not change, but when it goes back to the front, Native memory will be higher than before.
[√] Flutter (Channel unknown, v1.5.2, on Microsoft Windows [Version 10.0.17134.706], locale zh-CN)
    • Flutter version 1.5.2 at C:\tool\flutter
    • Framework revision efe744a360 (2 days ago), 2019-04-17 10:43:19 -0400
    • Engine revision fdd427241b
    • Dart version 2.2.1 (build 2.2.1-dev.4.2 8e73b3c006)


[√] Android toolchain - develop for Android devices (Android SDK version 28.0.3)
    • Android SDK at C:\Users\xxx\AppData\Local\Android\sdk
    • Android NDK location not configured (optional; useful for native profiling support)
    • Platform android-28, build-tools 28.0.3
    • ANDROID_HOME = C:\Users\xxx\AppData\Local\Android\sdk
    • Java binary at: C:\tool\android-studio\jre\bin\java
    • Java version OpenJDK Runtime Environment (build 1.8.0_152-release-1248-b01)
    • All Android licenses accepted.

[√] Android Studio (version 3.3)
    • Android Studio at C:\tool\android-studio
    • Flutter plugin version 34.0.1
    • Dart plugin version 182.5215
    • Java version OpenJDK Runtime Environment (build 1.8.0_152-release-1248-b01)

[√] IntelliJ IDEA Community Edition (version 2018.2)
    • IntelliJ at C:\Program Files\JetBrains\IntelliJ IDEA Community Edition 2018.2.1
    • Flutter plugin version 34.0.1
    • Dart plugin version 182.5215

[√] VS Code, 64-bit edition (version 1.31.1)
    • VS Code at C:\Program Files\Microsoft VS Code
    • Flutter extension version 2.25.1

[√] Connected device (1 available)
    • KNT AL10 • 69DDU16511000544 • android-arm64 • Android 6.0 (API 23)
import 'package:flutter/material.dart';
import 'package:flutter/cupertino.dart';

void main() async {
	runApp(App());
}

class App extends StatefulWidget {
	App() {
		print("new App");
	}

	@override
	_AppState createState() => new _AppState();

}

class _AppState extends State<App> {
	@override
	void initState() {
		super.initState();
	}

	@override
	void dispose() {
		super.dispose();
	}

	@override
	Widget build(BuildContext context) {
		print("App Build");
		return new MaterialApp(
			title: "test",
			home: Boot()
		);
	}
}

class Boot extends StatefulWidget {
	Boot({Key key}) : super(key: key);

	@override
	BootState createState() => new BootState();
}

class BootState extends State<Boot> {
	@override
	void initState() {
		super.initState();
	}

	@override
	void dispose() {
		super.dispose();
	}

	@override
	Widget build(BuildContext context) {
		List<Widget> res = [];
		for(int i = 0; i < 200; i++){
			res.add(
				new Container(
					height: 20.0,
					decoration: new BoxDecoration(
						border: new Border(
							bottom: new BorderSide(
								color: Theme.of(context).dividerColor
							)
						)
					),
					child: new Text(
						i.toString()
					),
				)
			);
		}
		return new Scaffold(
			body: new Stack(
				children: <Widget>[
					new Positioned(
						child: new Image.network(
							"http://47.254.30.207/background.png",
							fit: BoxFit.cover,
						),
						left: 0.0,
						top: 0.0,
						width: MediaQuery.of(context).size.width,
						height: MediaQuery.of(context).size.height,
					),
					new Positioned(
						left: 0.0,
						top: 0.0,
						width: MediaQuery.of(context).size.width,
						height: MediaQuery.of(context).size.height,
						child: new Center(
							child: new CupertinoActivityIndicator(
								animating: true,
								radius: 50.0,
							),
						),
					)
				],
			),
		);
	}
}
Activity
fly512 commentedon Apr 19, 2019
@mklim @kangwang1988
mklim commentedon Apr 19, 2019
Thanks for reporting the bug!
In debug mode I'm seeing memory climbing just from combining the loop/array with the animation even without any image.
So far I've been unable to reproduce any kind of memory climb at all in release mode though.
Just making sure, are you seeing this leak in both release mode and debug mode?
fly512 commentedon Apr 20, 2019
@mklim We also found this problem in profile and release modes, as long as the time is long enough (the screen is not closed, less than the background, hours) memory will continue to grow, when the UI is very complex, memory growth is very fast.
We also found that if there were no image resources on the UI, there would be no problem.
fly512 commentedon Apr 20, 2019
Profile Mode
A more complex UI was redone and ran for more than an hour (the screen was always on in the front desk).
You'll find that Native memory keeps going up.
2 hours
fly512 commentedon Apr 20, 2019
This is the test code.
Two resource images are needed in the assets/images/ directory, as shown in the annex.
fly512 commentedon Apr 22, 2019
@mklim I'm sorry to disturb you. Very anxious, online project
mklim commentedon Apr 22, 2019
Got it, thanks for the clarification. And it's not a problem, thanks for the extra info. Looking into it again.
mklim commentedon Apr 22, 2019
I'm seeing a leak with the latest sample case. No OOM crash yet, but I can see it climbing just from letting it run for a couple minutes. /cc @jason-simmons
mklim commentedon Apr 22, 2019
I think
ImageCacheis likely related here. I'm not seeing the same linear climb withmaximumSize = 0.jason-simmons commentedon Apr 22, 2019
I noticed that a lot of
EngineLayerobjects are not being garbage collected promptly when running this app. IncreasingEngineLayer::GetAllocationSizeto something much higher seems to help.fly512 commentedon Apr 23, 2019
Thank you very much. We will adjust Engine Layer:: GetAllocation Size and then test it.
18 remaining items
zhileichen commentedon Apr 28, 2019
Are any optimizations turned on to disable the modification of EngineLayer::GetAllocationSize in the Release mode ?
mraleph commentedon Apr 28, 2019
@dnfield I don't think there is any amazing GC based solution here - it a fairly classical issue when GC managed heap retains native resources of unknown size. If you have an object which is managed by GC then you need to periodically trigger full GC to collect it. For GC to trigger VM needs to understand that heap is too large. However if full GC triggers too often - you get performance degradation.
/cc @rmacnak-google
liyuqian commentedon Apr 28, 2019
@zhileichen I think huge
EngineLayer::GetAllocationSizein the profile mode may be triggering full GC to collect memory in other places. It seems that doesn't happen in release mode so you may need to find another way. @mraleph and @rmacnak-google from the Dart team may have better suggestions to that end.fly512 commentedon May 21, 2019
@jason-simmons @mklim @dnfield
I'm sorry to interrupt. Is there any progress to solve this problem?
fly512 commentedon May 31, 2019
@jason-simmons @mklim @dnfield
I'm sorry to interrupt. Is there any progress to solve this problem?
liyuqian commentedon Nov 25, 2019
Bringing this back to our attentions. This is already a "customer: crowd" issue, and I just heard from @cbracken that Fuchsia is also experiencing this kind of memory issue (the memory usage keeps going up). So this issue is becoming more and more important.
Here's one potential strategy to fix this:
dnfield commentedon Nov 26, 2019
Since this bug was opened, we've reduced the size of the Skia resource cache significantly. Is it significantly increasing beyond that?
We should take a look at where the allocated memory is going.
liyuqian commentedon Nov 26, 2019
@dnfield : if it never increases beyond that point, which means that this issue is no longer reproducible, then we can close this issue without further work :D That's the best case and I do hope Michael would give us that good news. And if that's indeed the case, we'll probably just file a separate issue on Fuchsia only as they may not set the resource cache properly.
mklim commentedon Nov 26, 2019
I'm not seeing an obvious leak given the earlier repro case from issuecomment-485139640. I am seeing an initial spike in memory, but the usage seems to drop back down to around 9400KB on my test device given enough time. Test data is in this spreadsheet.
Given that I think we should close this and re-open new issues about leaks in the future with specific reproduction cases. Memory leaks can come from basically anywhere, so it's likely whatever was root causing this initially has been fixed like @dnfield suggested and the leaks @cbracken is reporting on Fuchsia are from a different path.
dnfield commentedon Nov 26, 2019
Thanks for the detailed analysis @mklim . A quick look at your data suggests to me that flutter-team-archive/engine#10434 probably helped this case significantly. The graphics cache is not getting larger than 50mb (assuming I have the scale right) in your sheet, whereas previously it would have been allowed to grow to about 10x that.
github-actions commentedon Aug 25, 2021
This thread has been automatically locked since there has not been any recent activity after it was closed. If you are still experiencing a similar issue, please open a new bug, including the output of
flutter doctor -vand a minimal reproduction of the issue.