Repository navigation
[BUG] Node/edge colors not running #241
Description
Activity
I took a look -- can you try setting
graphistry.register(api=3, username='...', password='...')at the top and rerun? This may be an issue around usingapi=1orapi=2protocols, which we can help with, but better to useapi=3Later today, will be releasing a new version of this notebook that is in a more modern style, including explicitly using
api=3featuresHi @Cedricyf I think I see what's happening.
When passing in a color attribute column, vs using a symbolic encoding, we handle
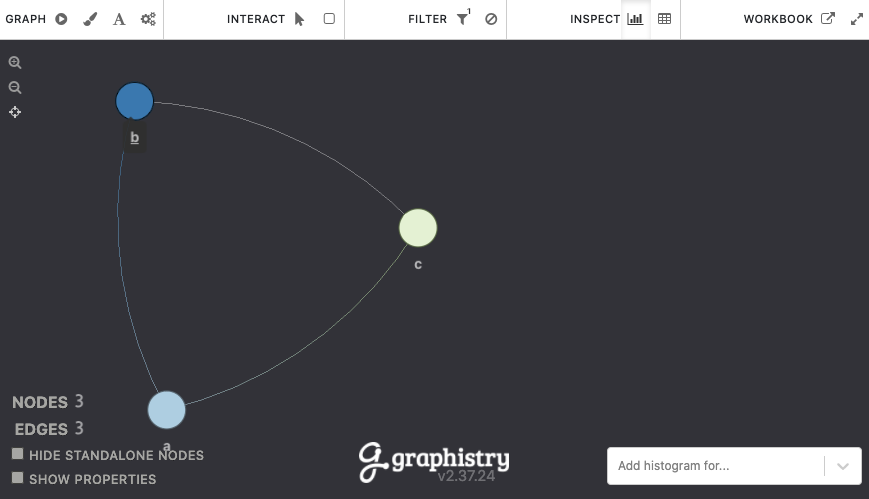
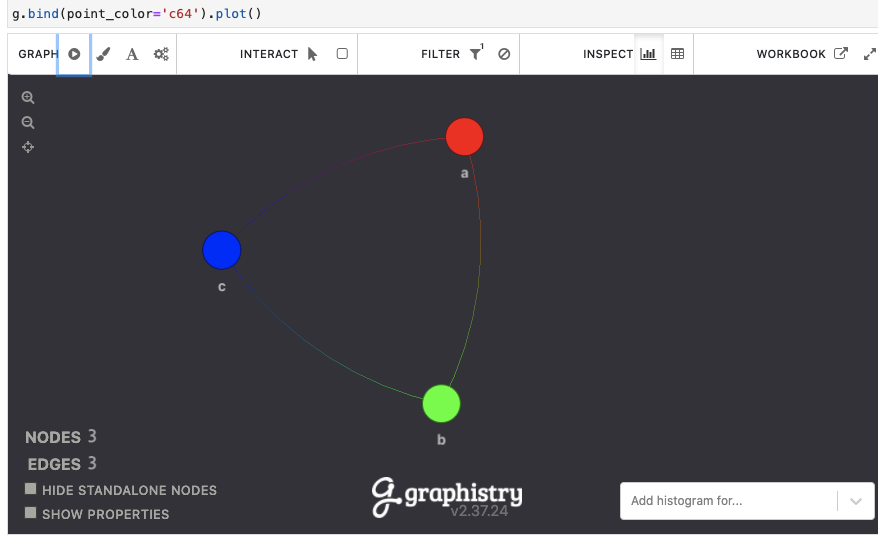
int32as palettes andint64as rgb hex values. I'm guessing you are using an unexpected type or value range. You can check whatg._nodes.info()shows to see which you are using, and pandasas_typeto convert. You can find more examples and theint32palettes here: https://hub.graphistry.com/docs/api/2/rest/upload/colors/#extendedpalette2Let me know how goes!
Quick example of both:
graphistry.register(api=3, username='...', password='...')

g = (graphistry
     .edges(
         pd.DataFrame({
             's': ['a', 'b', 'c'],
             'd': ['b', 'c', 'a']}),
         's', 'd')
     .nodes(
         pd.DataFrame({
             'n': ['a', 'b', 'c'],
             'c32': pd.Series([0, 1, 2], dtype='int32'),
             # format is 0xRRGGBB00
             'c64': pd.Series([0xFF000000, 0x00FF0000, 0x0000FF00], dtype='int64')
         }),
         'n'))

g._nodes.info()
=>
<class 'pandas.core.frame.DataFrame'>
RangeIndex: 3 entries, 0 to 2
Data columns (total 3 columns):
 #   Column  Non-Null Count  Dtype
---  ------  --------------  -----
 0   n       3 non-null      object
 1   c32     3 non-null      int32
 2   c64     3 non-null      int64
dtypes: int32(1), int64(1), object(1)
memory usage: 188.0+ bytes
Then to plot:
# int32 => palette
g.bind(point_color='c32').plot()
# int64 => rgb int
g.bind(point_color='c64').plot()
=>


Describe the bug
When setting the node or edge color, the figure only show the black color (using the exact code for the honeydot example)
To Reproduce
Browser environment (please complete the following information):
PyGraphistry environment