Tight bounding box not calculated correctly for WCSAxes #10796
Description

Using the below code should draw a tight bounding box round a given axes. This works correctly for normal Matplotlib axes, as can be seen in the bottom subplot, but fails for WCSAxes, as seen in the top subplot. For some reason the width/height do not seem to be calculated correctly.
I think this is the root cause of #8703

from astropy.wcs import WCS
from astropy.io import fits
from astropy.utils.data import get_pkg_data_filename
import matplotlib.pyplot as plt

filename = get_pkg_data_filename('galactic_center/gc_msx_e.fits')

hdu = fits.open(filename)[0]
wcs = WCS(hdu.header)

fig = plt.figure()
ax1 = fig.add_subplot(2, 1, 1, projection=wcs)
ax2 = fig.add_subplot(2, 1, 2)

fig.canvas.draw()
renderer = fig.canvas.renderer

for ax in [ax1, ax2]:

    ax_box = ax.get_tightbbox(renderer)

    rect = plt.Rectangle((ax_box.x0, ax_box.y0), width=ax_box.width, height=ax_box.height,
                         linewidth=72./fig.dpi, edgecolor="red", facecolor="none",
                         transform=None)
    fig.add_artist(rect)

plt.show()
Activity
dstansby commentedon Oct 4, 2020
Looks like the issue is that the internal WCSAxes
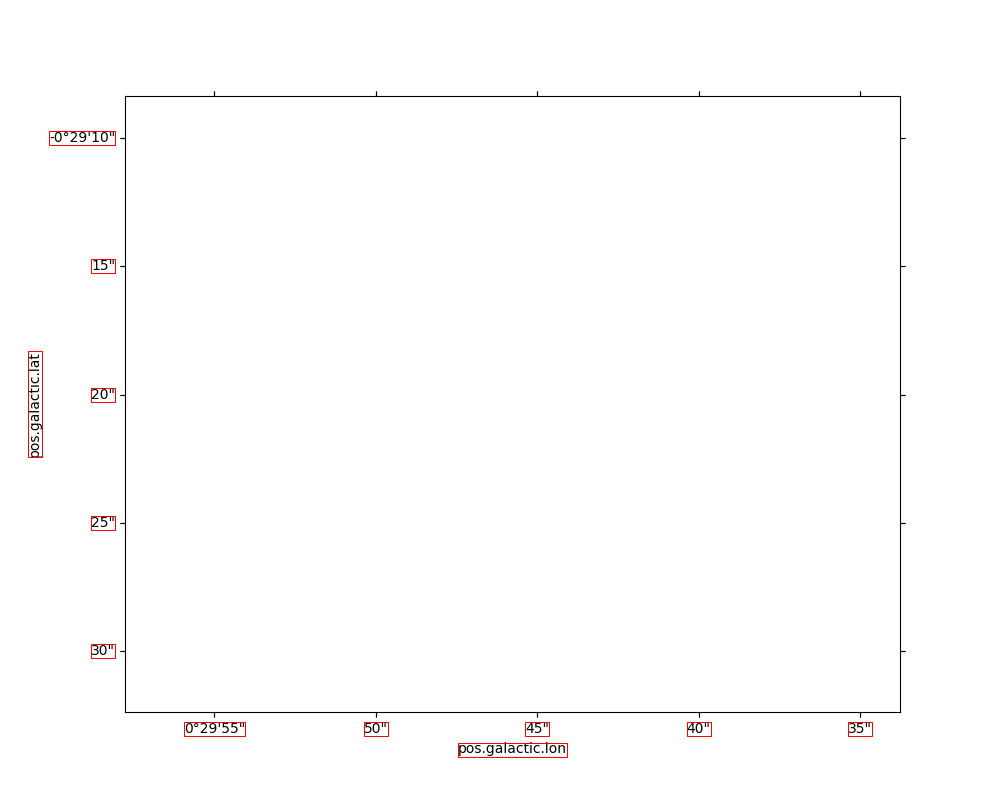
get_tightbboxis only returning the union of the bounding boxes of the text, this is what all the bboxes look like: