Repository navigation
Cache gRPC connections #1164

Description
Activity
Forgot to mention the request interceptor does'nt work too in my test... if you can explain me how to implement it the right way ?!
Thanks for the note @pierre-b . @stephenplusplus , thoughts on switching our transport?
Unfortunately, wreck is only written for Node v4 and greater. We still need to support v0.12.0.
We switched Pub/Sub to use gRPC and proto files with our last release. Because that library is used, the request interceptors don't have an impact. I'll make a note of that in the docs.
When I'm trying to test with your repo, I'm running into:
{"statusCode":400,"error":"Bad Request","message":"Invalid cookie value"}Is there a quick solution to get past that?
Thank you guys for investigating this!
@stephenplusplus maybe you need to clear your cookies? looks like HAPI tries to parse something on your localhost?!
Thanks, that did it. Can you show the passenger command you're running to see that output?
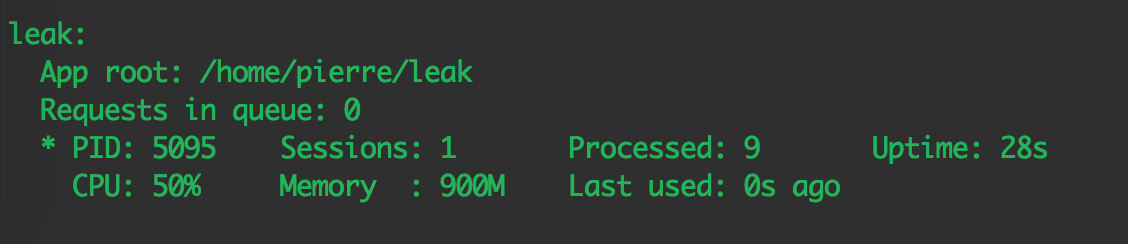
sudo watch passenger-statusIn your demo, after downgrading to [email protected], the memory hike was negligible. I believe this can be traced to grpc, which was introduced as the Pub/Sub transport in version [email protected].
I confirm 0.27.0 is much better!
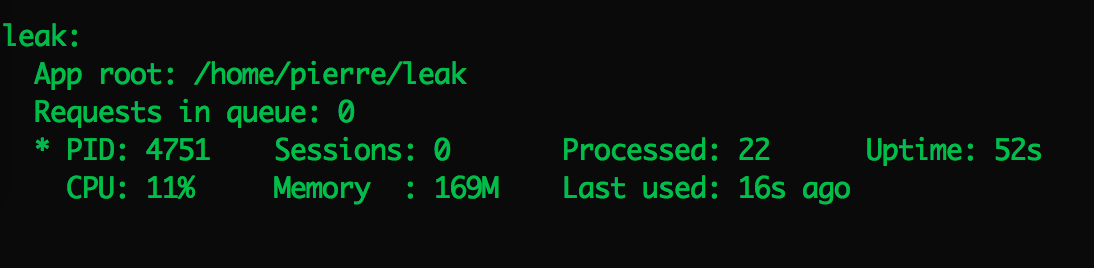
115M after 22 requests (each request publishes 100 messages in parallel)Also, [email protected] used in [email protected] consumes 27% less memory than [email protected].
22 requests (each request publishes 100 messages in parallel):
2.53.0: 124M
2.69.0: 171M@pierre-b would you mind opening an issue on the grpc repo about the high memory usage? I tried digging into it, but no doubt they'd be more efficient.
There is no open issue regarding a memory leak on the grpc nodejs repo, are you sure the problem comes from them and not the pubsub implementation?
As I never implemented the grpc node package I don't feel rightful to open an issue on their repo!
I completely understand :)
@murgatroid99 The test @pierre-b put together instantiates a service 100x, which hikes the memory usage up by about 100 MB. We don't retain a reference to the object, but it seems to persist in memory. Is this something that will be resolved once we pre-compile the proto files and use message objects (#1134 (comment))?
This usage pattern is not expected or intended to be performant. Each time you instantiate a service object, it creates a channel, which contains a number of things, including a full TCP socket/TLS session/HTTP2 session stack. This has to stay alive at least until the call you make with it is complete.
It would be better to initialize a single client object per server/service combination, and then use it for every call to that service on that server. This will allow gRPC to multiplex the calls on a single TCP connection, and will avoid having to deal with initial connection delay every single time you make a call.
Thanks, that gives me a lot to think about. I'm still wondering why the memory remains after the service calls have been made, however. Is there an extra step to stop the channel?
Also, regarding caching service connections, it will be difficult to know if a user is making a single call or many. Is there a default amount of time that passes that will close a channel? Would this caching be better handled within grpc?
8 remaining items
Thanks, will try it out ;)
Opened an issue on the gRPC library to track the memory leak: grpc/grpc#5970
Hello guys,
I've just started using gcloud-node, 3 days ago. I am using Pub/Sub to publish a stream of packets that my server receives, converts to JSON and publish it.
All good until I deployed on the server and started receiving more traffic. The process increases memory usage until it crashes.I see all related issues to this memory leak problem are closed, so let me know if you guys would like me to open a new issue. I've isolated the problem and the memory leak happens only when using cloud topic.publish a lot of times.
My environment is:
- Linux Ubuntu 14.04
- Node.js 5.6.0
- gcloud 0.37.0
Below is the chart showing how the memory increases, from process.memoryUsage(). From 17:10 to 17:50 there is an execution measure in the aforementioned environment.

Please let me know if any further information is needed.
Thanks for the report. I believe this was resolved upstream in gRPC, although it hasn't been merged yet:
- My repro repo: https://github.com/stephenplusplus/grpc-memory-leak
- The issue on gRPC: Node: Memory leak grpc/grpc#7349
- The PR with the fix on gRPC: Fix a memory leak in Node call credentials grpc/grpc#7394
It will probably take a while for the change to appear in this library. You should be able to install grpc from that PR's branch manually in the meantime:
$ npm install --save murgatroid99/grpc#node_client_creds_memory_leak
Sorry about the crashing :(
Ok, thanks Stephen!
- added a commit that references this issue
on Jan 28, 2026 - added a commit that references this issue
on Feb 5, 2026 - added a commit that references this issue
on Feb 17, 2026 - added a commit that references this issue
on Mar 11, 2026 - added a commit that references this issue
on Mar 11, 2026 - added a commit that references this issue
on Mar 18, 2026


Hello guys,
I use PubSub to pulish thousands of messages and a memory leak crashes my server.
Here is a Passenger screenshot using gcloud:
Using request:
Here is a simple repo to reproduce it: https://github.com/pierre-b/test-leak
Environnement:
Did I miss something?
thanks for your help